

Ipsa Tripathy
Bhubaneswar: Every year after Diwali, screenshots of alarming air quality readings circulate on social media. This year, one figure attracted particular attention: Bhubaneswar’s Air Quality Index (AQI) reportedly crossed 1,000 on Diwali night. It was a striking number, but it also raised questions. How bad was the pollution, where did the figure come from, and what do the official readings tell us?
A comparison of air quality before and after the festival confirms that pollution levels rose sharply in both Bhubaneswar and Cuttack. However, the figures need to be understood in context because different monitoring platforms use different methods and scales.
The Central Pollution Control Board (CPCB) publishes India’s official AQI. Its daily readings are based on a 24-hour assessment and are reported at 4 pm. The Indian AQI scale ranges from 0 to 500, with higher values indicating greater levels of pollution.
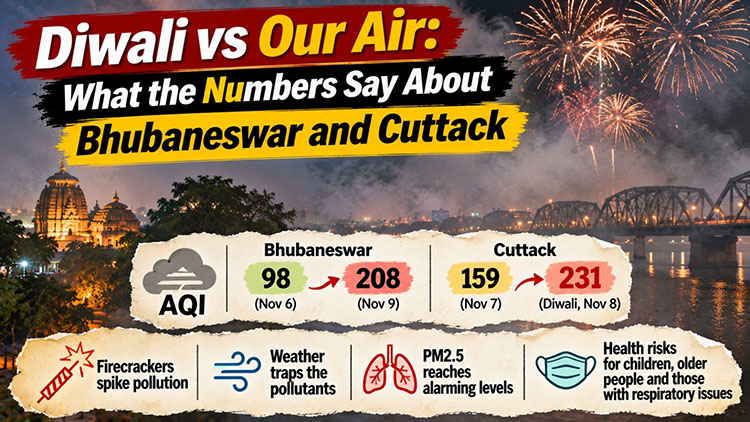
Before Diwali, Bhubaneswar’s air quality was relatively better. On November 6, two days before the festival, the city’s AQI stood at 98, placing it in the satisfactory category. The situation began to deteriorate as Diwali approached. On November 7, the reading rose to 112, while Cuttack recorded 159. On Diwali day, November 8, Bhubaneswar’s AQI reached 163 and Cuttack’s climbed to 231, placing the latter in the poor category.
The deterioration continued after the celebrations. On November 9, Bhubaneswar recorded an AQI of 208, moving into the poor category, while Cuttack stood at 193. By 9:05 am on November 10, the readings had fallen to 138 in Bhubaneswar and 125 in Cuttack, bringing both cities back into the moderate category.
The change in Bhubaneswar is particularly clear when the November 6 and November 9 readings are compared. The AQI increased from 98 to 208 in three days, more than doubling over that period. Cuttack experienced its sharpest deterioration earlier, with its air quality already reaching the poor category on Diwali itself.
There is an important detail about the timing of these readings. The CPCB’s November 8 figure represents the 24-hour period ending at 4 pm. It therefore does not capture most of the firecracker activity that took place later that evening. The November 9 reading provides a clearer picture of the pollution that remained after Diwali night. At 11:30 am on November 9, Bhubaneswar’s AQI was recorded at 206, while Cuttack stood at 192.
So where did the figure of more than 1,000 come from?
Those much higher readings were reported by private monitoring platforms rather than the CPCB. According to AQI.in, Bhubaneswar’s AQI reached 1,091 at 9 pm on Diwali night and climbed to 1,254 by 9:30 pm. The platform recorded an even higher reading of 1,444 at 11:01 pm. At that point, Bhubaneswar was reported to have one of the highest pollution readings among Indian cities.
Some localities recorded particularly high figures. At around 11 pm, AQI.in reported readings of 1,291 in Shastri Nagar, 1,284 in AG Colony, 1,207 in Bapuji Nagar and 1,050 in Patia.
These figures should not be confused with the CPCB’s official daily AQI. The two systems use different approaches. The CPCB’s Indian AQI is capped at 500 and is based on a longer averaging period. The private platform reported much higher, short-term readings using the American AQI scale, which can extend beyond 500 and allows more immediate changes in pollution levels to be seen.
Both sets of readings point towards a serious deterioration in air quality, but they describe different aspects of the same event. The CPCB figures provide a basis for comparing daily conditions before and after Diwali, while the private readings indicate how severe pollution became during particular hours of the night.
Fine particulate matter was a major concern. PM2.5 refers to particles small enough to penetrate deep into the respiratory system. According to AQI.in, Bhubaneswar’s PM2.5 concentration reached 622 micrograms per cubic metre at 9 pm on Diwali night, while PM10 reached 750 micrograms per cubic metre. For comparison, India’s national 24-hour standard for PM2.5 is 60 micrograms per cubic metre.
These short-term readings are not directly comparable with a 24-hour standard, but they indicate how heavily polluted the air became during the evening. Such particles can irritate the respiratory system and worsen existing conditions. Children, older people and those with asthma or other respiratory illnesses are particularly vulnerable.
Residents in several parts of the twin cities reported coughing and irritation in their eyes. AIIMS Bhubaneswar also treated 28 firecracker-related and burn cases over the Diwali weekend. While these cases do not all establish a direct link to air pollution, they reflect some of the health and safety risks associated with festival celebrations involving fireworks.
The rise in pollution also raises questions about how effectively the restrictions were enforced. The Odisha State Pollution Control Board and local authorities had limited the use of firecrackers to a short period on Diwali evening. Reports differed on whether the permitted window ended at 8 pm or 9 pm. Authorities had also asked residents to use only green crackers.
Yet the pollution readings continued to rise well after the permitted period. The high late-night figures suggest that restrictions were not followed consistently. The use of fireworks outside the authorised hours, along with other sources of pollution, contributed to the deterioration in air quality.
Firecrackers were not the only factor. Vehicle emissions and existing industrial pollution also contribute to the background pollution in both cities. Weather conditions can make the situation worse. During November, cooler temperatures and weak winds can limit the dispersal of pollutants, allowing particles to remain concentrated near the ground for longer periods.
The comparison with previous Diwali celebrations offers another perspective. On Diwali day last year, Bhubaneswar’s CPCB AQI was recorded at 54 at 4 pm, placing it in the satisfactory category. By the following morning, however, the city’s reading had increased to 177. This year’s peak official daily reading of 208 on November 9 was higher. Since the measurements were taken at different times, a direct comparison has limitations, but the figures suggest that this year’s post-Diwali pollution was more severe.
The capital was not the only place in Odisha facing poor air quality. On the morning of November 9, Bileipada in Kendujhar recorded an AQI of 288, the highest reported in the state. Talcher followed at 266. Both areas have significant mining and industrial activity, meaning their pollution levels are influenced by sources that operate throughout the year, not just during festivals.
There was some improvement by the following morning. On November 10, Bhubaneswar’s AQI had fallen to 138 and Cuttack’s to 125. Both cities returned to the moderate category, suggesting that the sharp pollution spike was beginning to ease.
But a temporary improvement should not obscure what the figures revealed. Within a few days, Bhubaneswar’s official AQI had more than doubled, while private monitoring recorded extremely high pollution levels during Diwali night. For people with existing respiratory problems, even a short period of severe pollution can be difficult.
Diwali celebrations do not need to lose their character, but the way fireworks are used can make a difference. Respecting permitted hours, avoiding prohibited crackers and organising community displays instead of allowing fireworks to be set off across every neighbourhood could help reduce the concentration of pollution.
The numbers from Bhubaneswar and Cuttack show that the problem is not limited to one night of celebration. Festival emissions add to pollution that is already present from vehicles, industry and other sources. Cleaner celebrations matter, but so does the year-round effort to improve the air people breathe.
